Harry’s House: Best Practices in Radon Mitigation

Are you familiar with the health impacts of radon and the best practices for mitigating its impact on building occupants? Radon is a naturally occurring radioactive gas – colorless and odorless - that comes from the breakdown of radioactive elements in soil and rocks. Without proper mitigation, the gas can enter buildings and have serious impacts on occupant health. Radon is known as the second leading cause of lung cancer behind smoking.

How do you know if you’re in an area where radon exposure is a concern? The Environmental Protection Agency (EPA) provides a map (left) showing radon zones by county.

Zone 1 has the most severe radon levels, although homes with elevated levels have been found in all areas. This is why, regardless of location, all homes should be tested. We can see from the map that in California, the most affected areas are in Santa Barbara and Ventura counties. For GreenPoint Rated (GPR) projects, radon mitigation is required for projects located in Zone 1 and recommended for Zones 2 and 3.

One of In Balance’s GPR projects, “Harry’s House”, is a multi-family senior affordable housing project in Santa Ynez (Zone 1). On recent site visits, we got a chance to look at some of the radon mitigation strategies being put into place. So, what does this look like?

The EPA provides Model Standards and Techniques for Control of Radon for various building types. For our GPR projects, we focus on the guidelines for new residential buildings, but the EPA also provides guidelines for other project types. See the EPA Radon Standards of Practice website for more information.

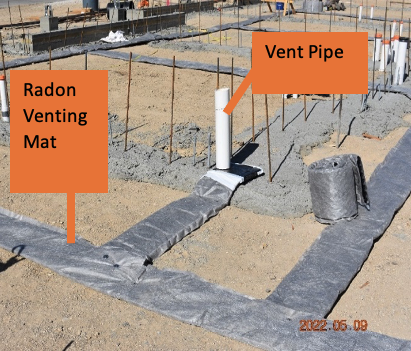
Step 1: Lay a perforated pipe in a four- to six inch continuous layer of coarse gravel under the foundation slab or on the crawlspace floor. Here, the project is using a 12” radon venting mat rolled out in a waffle pattern. A stub out for the vertical venting pipe has been placed.


Step 2: Place course gravel over radon venting mat. Lay continuous vapor barrier (6 mm minimum) over gravel – taped and sealed. Concrete will be poured directly onto vapor barrier.


Step 3: Connect the horizontal perforated pipe(s)/venting mat to a gas-tight, solid 3-4” pipe(s) running vertically from slab to the attic and through the roof for passive sub-slab/membrane depressurization. Use mechanical vent fan as required.


Other best practices

·      Seal all penetrations or cracks in the slab, foundation, or crawlspace floor with caulk or adhesive sealant.

·      Provide an electrical receptacle in the attic or outside the building for the future installation of a fan (for active depressurization).

·      Test for radon after construction. This test can occur prior to occupancy or after occupancy. For GPR, the test must be completed by a Certified Tester as identified on the California Department of Public Health (CDPH) website. Home test kits are also widely available.

·      If the test results are greater than 4 picocuries per liter (pCi/L), install onto the vent pipe an in-line continuously operating fan for active depressurization.

Using these best practices during construction can go a long way in ensuring the health and safety of building occupants. We recommend testing and implementing appropriate strategies even if it isn’t necessarily required by a certification program.

Cool Roofs Are Even Cooler

As the 2022 Energy Code update moves closer to its January 1, 2023 start date, we’re seeing more firms designing to the new code and needing to know what will be required. We recently outlined the new requirements for PVs and batteries for non-residential construction. Here we touch on the small but important shifts in requirements for non-residential roofing. Specifically, there are updates to solar reflectance, emissivity and air barriers.

Solar Reflectance (SR) or albedo, is the percentage of solar energy reflected by a surface. In the code, the scale is 0 – 1, where 0 is a black surface and 1.0 is a white surface. In all but two California climate zones (CZ 1 and 3), prescriptive SR for steep roofs will increase (lighter color), from 0.20 to 0.25. Low-sloped roofs (less than 2:12) won’t change in the new code, but are still required to have a higher SR at 0.63 across all climate zones.

Emissivity is the effectiveness of a material in emitting energy as thermal radiation. Again, the scale is 0 – 1, where higher numbers indicate more ability to shed heat. Prescriptively, emissivity for steep-sloped roofs will increase from 0.75 to 0.80 for all California climate zones except CZ 1 and 3. Low-sloped roofs will remain at 0.75.

Note that you’ll also see data on Solar Reflective Index, or SRI. SRI is calculated using solar reflectance and emissivity together and uses a scale of 1 – 100. In the code, you can use either SRI alone, or emissivity and solar reflectance together. For steep-sloped roofs, other than CZ 1 and 3, the SRI increased from 16 to 23. Low-sloped roofs SRI will remain at 75.

Air Barriers, which are applicable to the whole building, will now be required in all California climate zones. Previously they were only required in climate zones 10-16.

The main take-away here is that the California Energy Commissioning is responding to increasing temperatures across California by requiring lighter-colored roofs that reflect the sun and keep buildings cooler inside, which reduces energy demand and, ultimately, carbon emissions.

Code questions? Let us help!

FREE Energy Code Coach for all those Title 24 Questions

Partnering with 3C-REN, we’re pleased to support the Energy Code Coach program, a free service for design professionals, contractors and building departments to answer energy code or CALGreen questions. Just call (805) 220-9991 or fill out this online form.

Recent Code Coach questions include:

·       2022 PV and battery requirements for a 3-story multi-family alteration

·       Commissioning requirements for a new tenant improvement

·       Information regarding multifamily incentives for heat pumps

·       Required forms during permit submission and upon inspection

·       Consequences of differences in window specs per Title 24 report and in field

You can always reach out to us directly and we’ll get your question answered and logged in. Contact us!

Want to Reduce Embodied Carbon in Your Next Project?

We all know that carbon emissions are at the root of climate change. Operational carbon (from the energy used to operate a building) has been dropping for a decade or more. But what of the carbon that is emitted during the manufacturing of materials and actual construction of that building?

Unlike a utility bill that quantifies the electricity or gas used in a month, our buildings don’t generally come with labels showing the carbon emissions incurred before we even step foot inside. This embodied carbon (EC) is knowable however – via a document called an EPD, or environmental product declaration.

EPDs can take many forms and may include information beyond just carbon emissions, such as data about the manufacturing process, sourcing, and other environmental measures. Importantly, they provide third-party verified data that can be used to compare the EC in products in a standardized “apples-to-apples” platform.

The simplest way to use EPDs is to compare the EC data for “Stages A1-A3” of a product, which include extraction, upstream transport, and manufacturing. (“Stages” is the term used in a full Life Cycle Analysis, from manufacture to use to end-of-life.)  This comparison is often done during conceptual or schematic design to inform broad decisions about structural materials.

Data from a manufacturer’s EPD showing Global Warming Potential in kg CO2 equiv.

EPDs can be found on manufacturer websites, if they’ve gone to the trouble of generating them. Here, we show a section of an EPD for 1 meter of I-Joist material. The embodied carbon is listed for stages A1-A3 and equals 1.82 kg CO2 equivalent.

This same data is also accessible in a variety of searchable databases. The EC3 Tool (below) is generally limited to data for stages A1-A3, while others offer data for the full life cycle. Here, we found the EC data for the same I-joist product and were able to compare it against other products in the same category.

EPD data for the same I-joist manufacturer as above and a competitor, compiled in the EC3 searchable database.

On a recent project, we conducted a simple EC analysis during the conceptual design phase. Starting with foundation, structure, and enclosure materials, we identified the industry baseline EC for a building of the same size, structure, and use. We then researched the embodied carbon content of products that would likely be specified for the project, as well as alternative products that would be readily available. With this information in hand, we were able to generate a rough estimate of potential EC savings in the proposed design.

In the case of structural wood for example, we were able to identify two manufacturers that could provide LVLs of the specified size and strength. Both reported EC below the industry baseline of 400 kg CO2 per m3. However, one was significantly lower than the other – a 31% reduction vs. 55%. This then informed the project team’s specifications moving into design development and ultimately contributing to a Zero Carbon certification on the horizon.  

Interested in reducing the embodied carbon in your next project? Contact us!